Dashboard
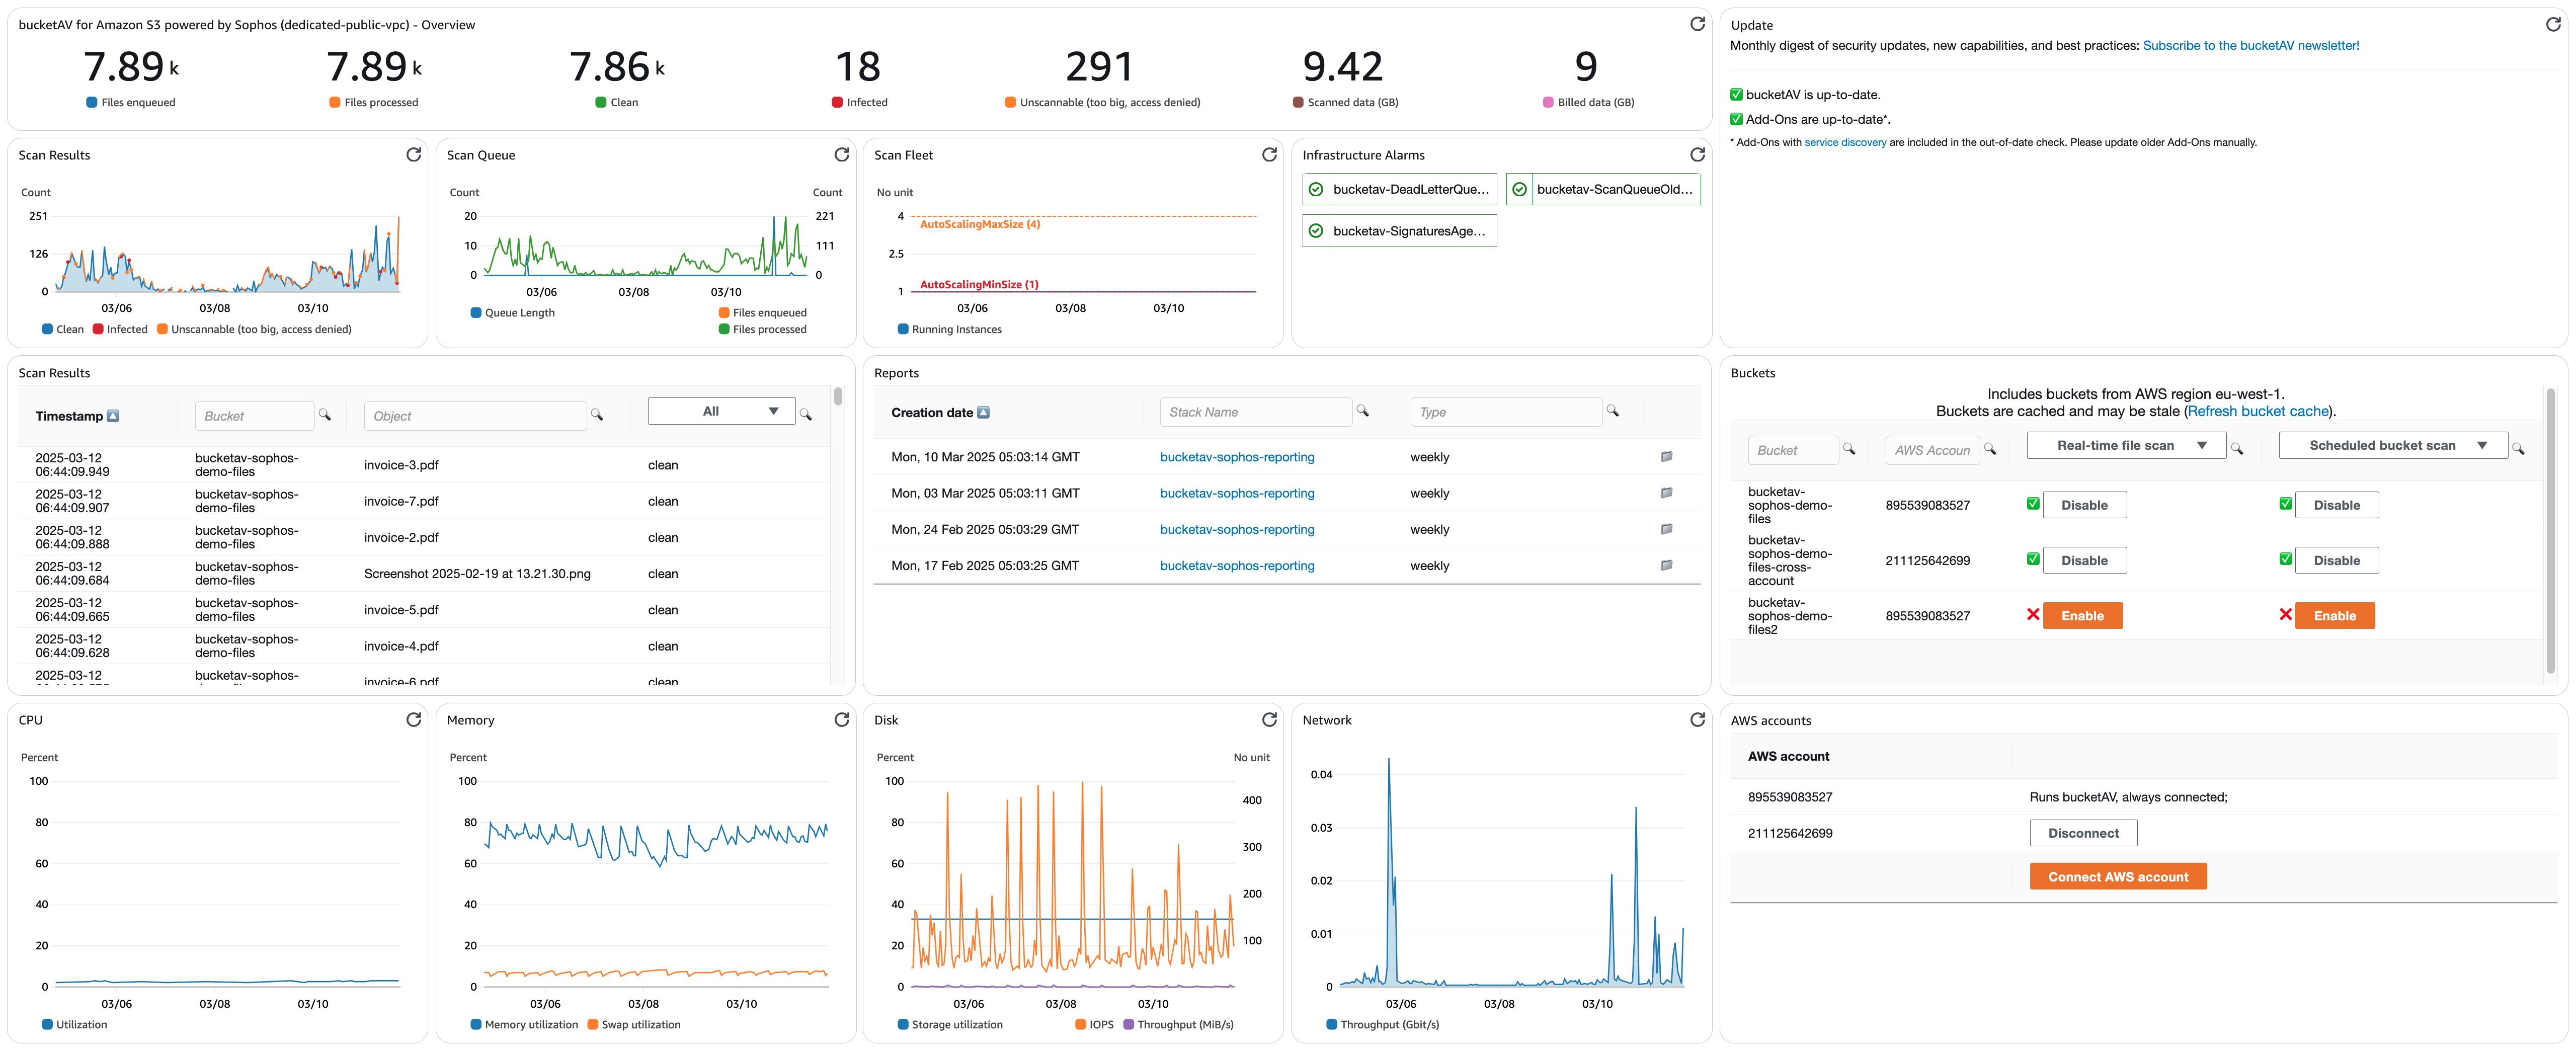
The dashboard provides a real-time overview over:
- Scan results: Number of clean, infected, and unscannable files and details.
- Scan Queue: Lenght of the queue and number of scan jobs added versus removed.
- Scan Fleet: Number of EC2 instances running.
- Infrastructure alarms: Shows the state of all the CloudWatch Alarms created by bucketAV for infrastructure monitoring.
- Reports: Generated by the reporting add-on.
- Buckets: List of all your buckets with protection status.
- Connected AWS accounts.
- CPU, memory, disk, and network utilization.
The scan results and reports are most important from a reporting perspective.
To open the dashboard:
- Visit the AWS CloudWatch Management Console.
- Navigate to Dashboards.
- Select the dashboard starting with the name
bucketavfollowed by the name of the AWS region—for example,bucketav-eu-west-1.